Styles of System Impact Assessment in Interconnection Studies
As we’ve outlined in a previous article, Contingency Analysis is the bread and butter of grid reliability studies. “Contingencies” can be anything – tripped lines, outaged generators, lost load, etc. – and NERC transmission planning standards require their modeling to ensure the grid can operate in off-nominal conditions. For each contingency, power flows on the grid are simulated. The results of a contingency analysis are a set of violations of acceptable reliability criteria, such as overloaded transmission lines or low bus voltages. These violations are then utilized to inform and advise planning (or operational) decisions, which (in the context of interconnection specifically) usually include siting and sizing of network upgrades.
Traditional Contingency Analysis
A typical contingency analysis process is shown below in Figure 1. A “DC” power flow is often run as a screening step, as it is fast to solve and is guaranteed to find a solution. If any monitored transmission line or transformer has a calculated (DC) flow within a certain threshold of its allowed rating, an “AC” power flow simulation is then performed to simulate the contingency with greater accuracy, checking to see if the overload is still observed.
Figure 1: Two-stage contingency analysis process (left). The first stage estimates potential system violations during a contingency event, such as an overloaded transmission line after a bus is disconnected (right). If a potential overload is detected, the second step runs a more accurate AC power flow to further evaluate the presence and magnitude of any violations.
In interconnection studies, a contingency analysis is often run on a “dispatched” AC power flow model. In other words, the ISO/utility builds a model of the grid with the queued projects added and set to an appropriate power output level, generally depending on seasonality and fuel type. For example, in a summer peak model, solar projects might be dispatched to 100% of their output, whereas in another model representing light load (e.g., nighttime conditions), these same projects might be dispatched to 0%. The contingency analysis is run in a “before and after” style so that violations clearly caused by the queued projects are identified, and mitigations are accurately cost-allocated to the responsible projects.
Deliverability Studies
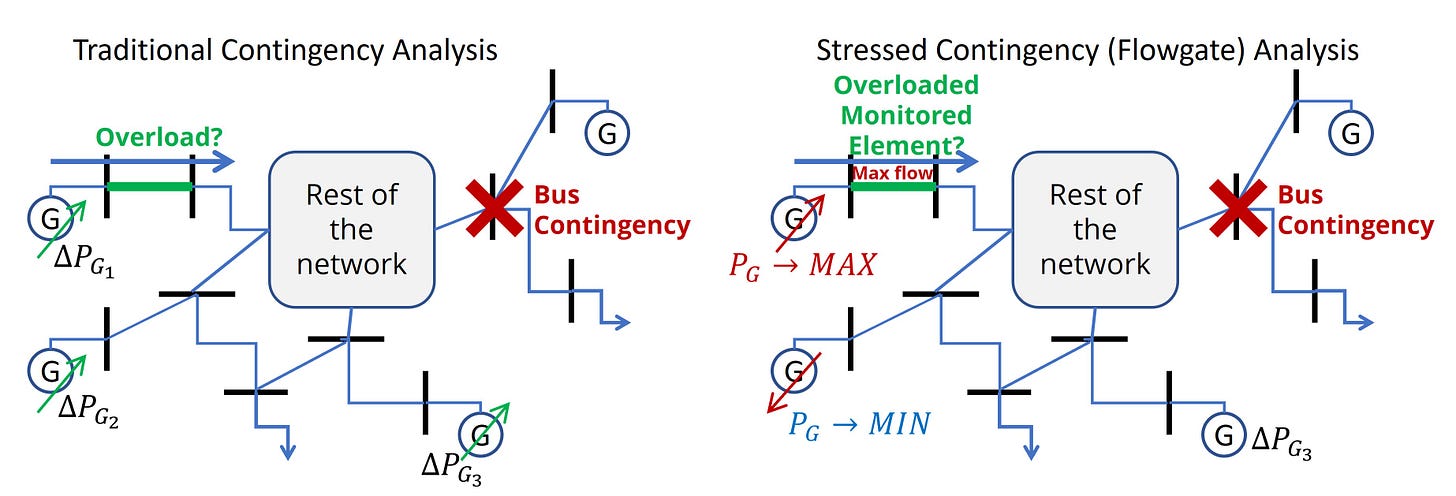
However, this is not the only approach to assessing the impacts of new generators. Other interconnection study methodologies focus on “deliverability” of generation by identifying flowgates – distinct monitored elements (e.g., transmission lines, transformers) in specific contingencies – that limit a generator’s output. In a flowgate study, generators under study are not strictly dispatched. Instead, for every monitored element in every contingency, the flow through that monitored element is maximized by adjusting the setpoints of generators that meet a specific distribution factor threshold. These generators are ramped to their maximum or minimum power output, whatever direction produces the worst-case flow through the monitored element. If this worst-case flow is within a specified threshold of the element’s rating, the scenario is then converted to an AC power flow case (by dispatching the generators to their ramped levels), and the contingency is re-simulated with AC power flow to confirm whether a violation has taken place.
Put simply, the “regular” style of contingency analysis fixes the generators at a specific power output (nominally – the setpoints of some generators may change to pick up the slack caused by generation going off-line in a contingency event) and simulates the contingency events to see what violations occur (Figure 2, left). In comparison, the “flowgate” style of contingency analysis intentionally stresses the system with unique dispatches to identify limiting elements (Figure 2, right).
Figure 2. Schematic representation of the two different flavors of contingency analysis.
Takeaways
Deliverability studies based on flowgate analysis tend to produce more conservative results, and in the context of an interconnection study, that usually means more monitored elements requiring an upgrade (and thus, potentially more network upgrade costs). However, ISOs/utilities do not necessarily use one or the other. In MISO, for example, traditional contingency analysis on a dispatched power flow model is used for ERIS analysis. A deliverability (flowgate) study is used for NRIS analysis, which is designed to ensure a generator’s output will not be curtailed in operation (barring emergencies). For a more in-depth explanation of ERIS v. NRIS, see Rao Konidena’s article here.


